The 2016 Chorley Borough Council election took place on 5 May 2016 to elect members of Chorley Borough Council in England.[1] This was on the same day as other local elections.
Council make-up
After the election, the composition of the council was:
| Party | Seats | Current Council (2016) | ||||||||||||||||||||||||||||||||||||||||||||||||||||
|---|---|---|---|---|---|---|---|---|---|---|---|---|---|---|---|---|---|---|---|---|---|---|---|---|---|---|---|---|---|---|---|---|---|---|---|---|---|---|---|---|---|---|---|---|---|---|---|---|---|---|---|---|---|---|
| 2010 | 2011 | 2012 | 2014 | 2015 | 2016 | |||||||||||||||||||||||||||||||||||||||||||||||||
| Labour | 15 | 20 | 24 | 32 | 30 | 30 | ||||||||||||||||||||||||||||||||||||||||||||||||
| Conservative | 27 | 23 | 20 | 13 | 14 | 14 | ||||||||||||||||||||||||||||||||||||||||||||||||
| Independent | 2 | 2 | 2 | 2 | 3 | 3 | ||||||||||||||||||||||||||||||||||||||||||||||||
| Lib Dems | 3 | 2 | 1 | 0 | 0 | 0 | ||||||||||||||||||||||||||||||||||||||||||||||||
Election result
| Party | Seats | Gains | Losses | Net gain/loss | Seats % | Votes % | Votes | +/− | |
|---|---|---|---|---|---|---|---|---|---|
| Labour | 10 | 0 | 0 | 68.8 | 52.9 | 13,780 | −0.5 | ||
| Conservative | 4 | 0 | 0 | 25.0 | 28.6 | 7,444 | −3.5 | ||
| Independent | 1 | 0 | 0 | 6.3 | 7.2 | 1,862 | +0.0 | ||
| UKIP | 0 | 0 | 0 | 0 | 6.3 | 1,652 | +2.2 | ||
| Liberal Democrats | 0 | 0 | 0 | 0 | 4.3 | 1,115 | +2.2 | ||
| Green | 0 | 0 | 0 | 0 | 0.7 | 183 | −0.4 | ||
Results map
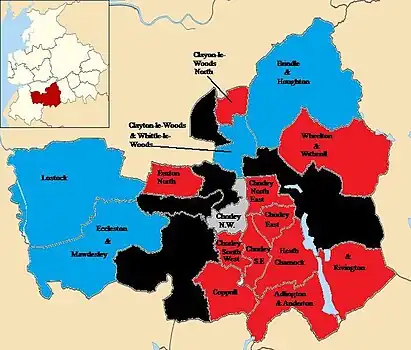 2016 results |
Previous 2012 results |
Wards
Adlington and Anderton
| Party | Candidate | Votes | % | ±% | |
|---|---|---|---|---|---|
| Labour | 1,425 | 61.4 | |||
| Conservative | Dorothy Livesey | 598 | 25.8 | ||
| Green | Andrew Whitson | 183 | 7.9 | ||
| Liberal Democrats | Philip William Pilling | 113 | 4.9 | ||
| Majority | 827 | 35.7 | |||
| Turnout | 2,319 | 40.4 | |||
| Labour hold | Swing | ||||
Brindle and Hoghton ward
| Party | Candidate | Votes | % | ±% | |
|---|---|---|---|---|---|
| Conservative | 350 | 44.3 | −19.4 | ||
| Independent | Steve Williams | 315 | 39.9 | N/A | |
| Labour | Yvonne Marie Hargreaves | 125 | 15.8 | −20.5 | |
| Majority | 35 | 4.4 | |||
| Turnout | 790 | 47.3 | |||
| Conservative hold | Swing | −29.7 | |||
Chorley East ward
| Party | Candidate | Votes | % | ±% | |
|---|---|---|---|---|---|
| Labour | 1,176 | 67.4 | −7.0 | ||
| UKIP | Christopher Suart | 348 | 19.9 | N/A | |
| Conservative | Aidy Riggott | 222 | 12.7 | −3.8 | |
| Majority | 828 | 47.4 | |||
| Turnout | 1,746 | 35.0 | |||
| Labour hold | Swing | ||||
Chorley North East ward
| Party | Candidate | Votes | % | ±% | |
|---|---|---|---|---|---|
| Labour | 1,049 | 63.7 | −0.2 | ||
| Conservative | Philip Adrian Ellis Loynes | 331 | 20.1 | +1.5 | |
| UKIP | Tommy Shorrock | 268 | 16.3 | +3.0 | |
| Majority | 718 | 43.6 | |||
| Turnout | 1,648 | 34.2 | |||
| Labour hold | Swing | −0.9 | |||
Chorley North West ward
| Party | Candidate | Votes | % | ±% | |
|---|---|---|---|---|---|
| Independent | 1,547 | 64.3 | −7.7 | ||
| Labour | Anthony Stephen Holgate | 547 | 22.7 | +3.7 | |
| Conservative | Sandra Mercer | 182 | 7.6 | −1.4 | |
| UKIP | Julia Winifred Mary Smith | 129 | 16.3 | N/A | |
| Majority | 1,000 | 41.6 | |||
| Turnout | 2,405 | 52.5 | |||
| Independent hold | Swing | -5.7 | |||
Chorley South East ward
| Party | Candidate | Votes | % | ±% | |
|---|---|---|---|---|---|
| Labour Co-op | 1,261 | 62.8 | +3.4 | ||
| Conservative | Dominic Keiran Jewell | 452 | 22.5 | −5.3 | |
| UKIP | Julia Winifred Mary Smith | 243 | 12.1 | N/A | |
| Liberal Democrats | David Porter | 52 | 2.6 | N/A | |
| Majority | 809 | 40.3 | |||
| Turnout | 2,008 | 36.4 | |||
| Labour Co-op hold | Swing | +4.4 | |||
Chorley South West ward
| Party | Candidate | Votes | % | ±% | |
|---|---|---|---|---|---|
| Labour | 1,351 | 73.7 | +3.5 | ||
| Conservative | Mrs. Sarah Louise Kiley | 483 | 26.3 | −3.5 | |
| Majority | 868 | 47.3 | |||
| Turnout | 1,834 | 31.1 | |||
| Labour hold | Swing | +3.5 | |||
Clayton-le-Woods and Whittle-le-Woods ward
| Party | Candidate | Votes | % | ±% | |
|---|---|---|---|---|---|
| Conservative | 1,126 | 46.1 | −12.5 | ||
| Labour | Mark Edward Clifford | 962 | 39.4 | −2.0 | |
| UKIP | Andrew Anthony Romanienko | 203 | 8.3 | N/A | |
| Liberal Democrats | Glenda Charlesworth | 151 | 6.2 | N/A | |
| Majority | 164 | 6.7 | |||
| Turnout | 2,442 | 38.0 | |||
| Conservative hold | Swing | −5.3 | |||
Clayton-le-Woods North ward
| Party | Candidate | Votes | % | ±% | |
|---|---|---|---|---|---|
| Labour | 1,027 | 61.8 | +3.4 | ||
| Conservative | Eileen Whiteford | 636 | 38.2 | −3.4 | |
| Majority | 391 | 23.5 | |||
| Turnout | 1,663 | 33.7 | |||
| Labour hold | Swing | +3.4 | |||
Coppull ward
| Party | Candidate | Votes | % | ±% | |
|---|---|---|---|---|---|
| Labour | 832 | 48.6 | −8.7 | ||
| Liberal Democrats | Simon Thomson | 610 | 35.6 | +4.3 | |
| Conservative | Harold Heaton | 271 | 15.8 | +4.5 | |
| Majority | 222 | 13.0 | |||
| Turnout | 1,713 | 35.6 | |||
| Labour hold | Swing | −6.5 | |||
Eccleston and Mawdesley ward
| Party | Candidate | Votes | % | ±% | |
|---|---|---|---|---|---|
| Conservative | 953 | 46.1 | −0.5 | ||
| Labour | Stanley Joseph Ely | 823 | 39.8 | −2.4 | |
| UKIP | Mark Smith | 292 | 14.1 | +3.0 | |
| Majority | 130 | 6.3 | |||
| Turnout | 2,068 | 41.8 | |||
| Conservative hold | Swing | +1.0 | |||
Euxton North ward
| Party | Candidate | Votes | % | ±% | |
|---|---|---|---|---|---|
| Labour | 1,108 | 72.4 | +18.6 | ||
| Conservative | Alan John Platt | 254 | 16.6 | −18.3 | |
| UKIP | Jeffrey Flinders Mallinson | 169 | 11.0 | −0.4 | |
| Majority | 854 | 55.8 | |||
| Turnout | 1,531 | 44.2 | |||
| Labour hold | Swing | +18.5 | |||
Heath Charnock and Rivington ward
| Party | Candidate | Votes | % | ±% | |
|---|---|---|---|---|---|
| Labour Co-op | 663 | 70.5 | +15.1 | ||
| Conservative | Peter Malpas | 277 | 29.5 | −2.9 | |
| Majority | 386 | 41.1 | |||
| Turnout | 940 | 54.4 | |||
| Labour Co-op hold | Swing | +9.0 | |||
Lostock ward
| Party | Candidate | Votes | % | ±% | |
|---|---|---|---|---|---|
| Conservative | 602 | 45.4 | −10.6 | ||
| Labour | Alan Whittaker | 534 | 40.3 | −3.7 | |
| Liberal Democrats | John Patrick Wright | 189 | 14.3 | N/A | |
| Majority | 68 | 5.1 | |||
| Turnout | 1,325 | 39.2 | |||
| Conservative hold | Swing | −3.5 | |||
Wheelton and Withnell ward
`
| Party | Candidate | Votes | % | ±% | |
|---|---|---|---|---|---|
| Labour | 897 | 55.9 | −2.9 | ||
| Conservative | Andrew James Snowden | 707 | 44.1 | +2.9 | |
| Majority | 190 | 11.8 | |||
| Turnout | 1,604 | 50.3 | |||
| Labour hold | Swing | −2.9 | |||
References
- ↑ "Guide to May 2016 elections in Scotland, Wales, England and Northern Ireland". BBC News. Retrieved 21 April 2016.
This article is issued from Wikipedia. The text is licensed under Creative Commons - Attribution - Sharealike. Additional terms may apply for the media files.